uk
uk en
enIELTS Bar Chart Model Essay
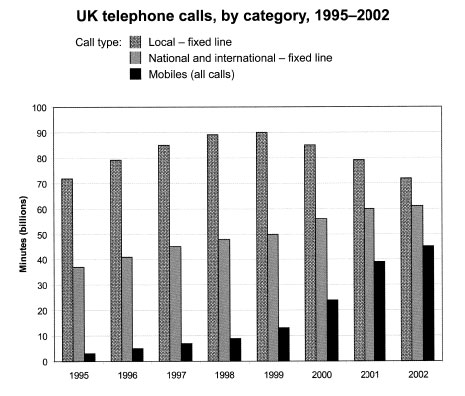
The chart below shows the total number of minutes (in billions) of the telephone calls in the UK, divided into three categories, from 1995-2002.
Summarise the information by selecting and reporting the main features, and make comparisons where relevant.
Write at least 150 words.
Sample answer
The information about the total amount of time spent on the three different types of phone calls in the UK during the period from 1995 to 2002 is given in the bar chart.
Overall, despite the total predominance of the number of minutes of local calls over national and those made by mobiles for this period, the latter two showed rising trends and in the last year (2002) shortened the gap significantly.
The highest index over all the period of time – 90 bln min – falls on local calls in 1999 – showing growing trend before this year, the pattern then dropped by 0.5 bln min. However, 2000 year turned up to be critical for mobile calls – indices of minutes doubled, and by 2002 have gone up 15 times compared to outgoing year (1995). By contrast, the total quantity of time spent on local calls, continuing to decrease after 2000, in 2002 returned to the primary value – 72 bln min (1995).
Compared to previously described patterns, the most gradual change was demonstrated by national calls – with every passed year the number of minutes grew moderately (on average by 0.5 bln min / year), which in the end of period under consideration totaled the insignificant increase.
Band score: 7.5 or 8.0